Facebook App Install Ad Spending Quadruples
- Wednesday, September 16th, 2015
- Share this article:

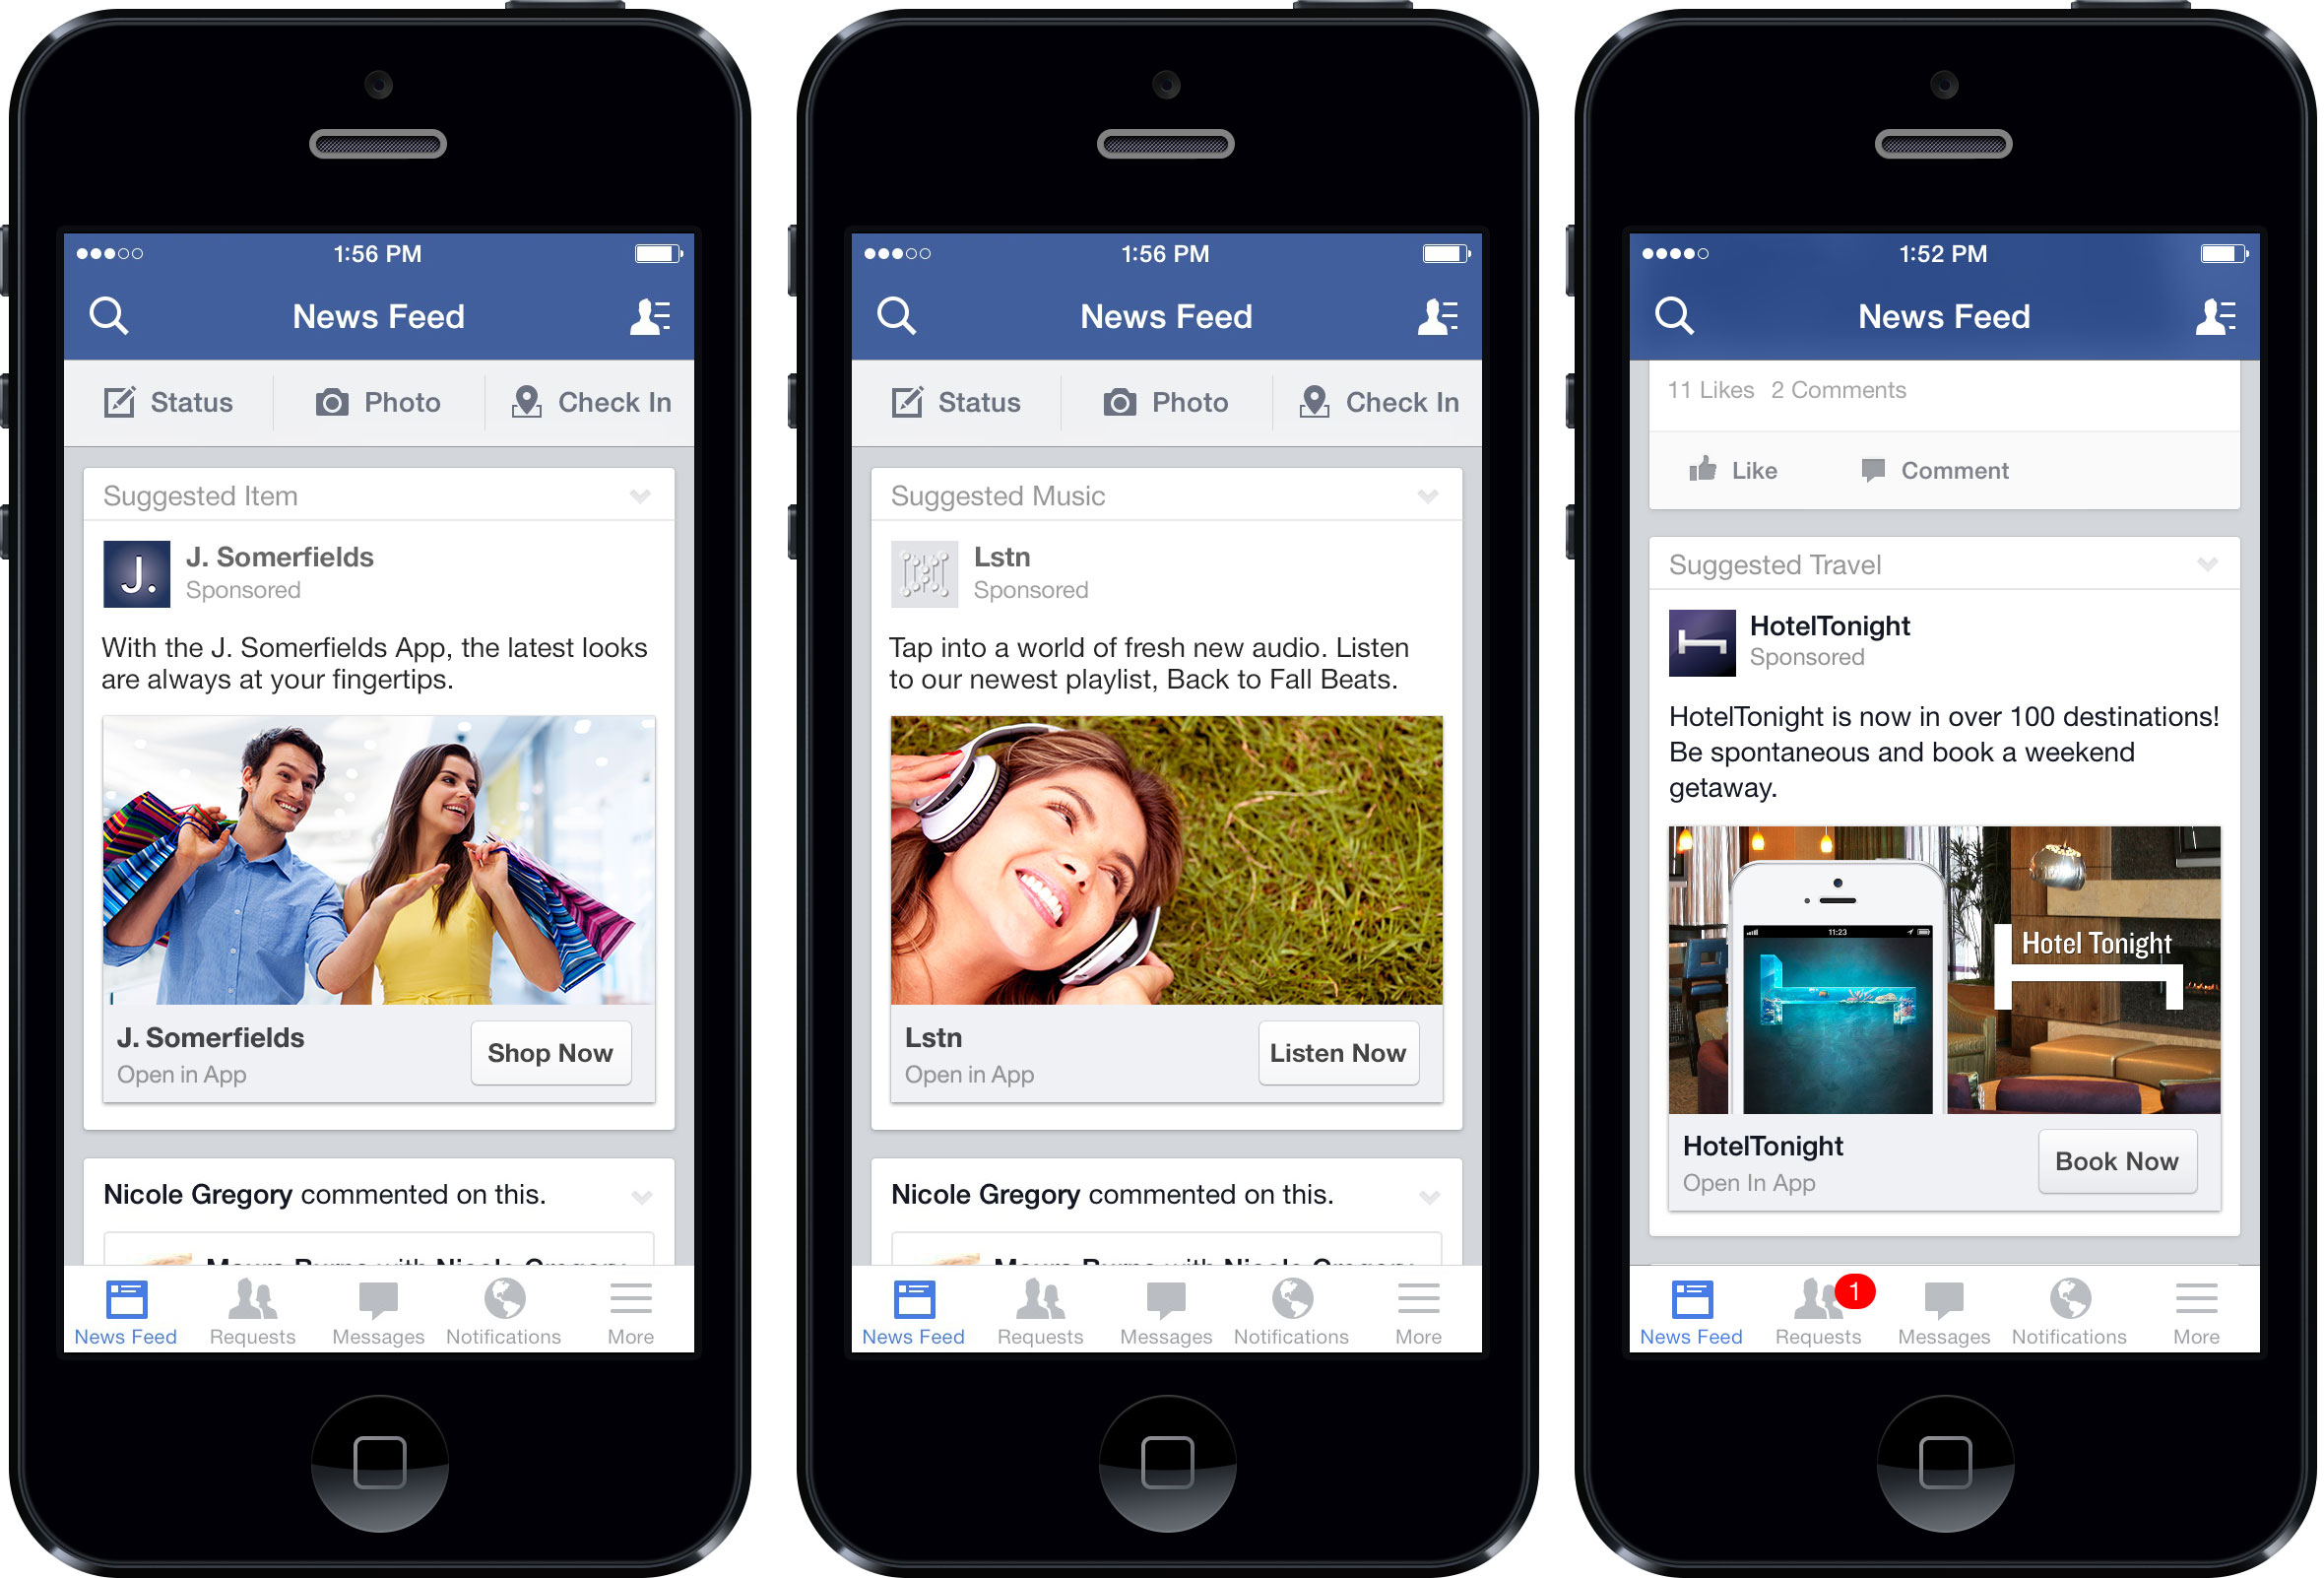 Marketers spent nearly four times (293 per cent) as much on Facebook mobile app install ads in Q2 2015 compared to Q2 2014, according to a new study from Kenshoo, Mobile App Advertising Trends Q2 2015. The study also reveals that app installs coming from the ads increased by 346 per cent over the same period.
The findings are based on a global dataset covering over $40m (£28m) in advertiser spend, and over 25m app installs, targeted across more than 100 countries worldwide, based on advertisers using Kenshoo’s Adquant platform that are mobile-only and have defined a mobile app install as a conversion.
While clickthrough rate (CTR) is down by 15 per cent year, the data shows that once a user has clicked on a Facebook mobile app install ad, 30 per cent of those clicks convert to an app install.
Looking at costs, the study reveals that the cost per click (CPC) for mobile app ads has increased 16 per cent year-on-year, while the cost per thousand impressions (CPM) has been flat, seeing just a 1 per cent decrease. The cost per install fell by 12 per cent.
“With people spending increasing amounts of time on mobile devices, enterprises from a wide range of businesses sectors, including retail, financial services and media, as well gaming companies, have invested in developing mobile apps,” said Rob Coyne Kenshoo managing director for EMEA. “The challenge remains how to get consumers to discover, download, install and ultimately, to buy in to the experience and continue to engage with apps.
“Mobile app ads are playing an important role here. The sizeable increase in mobile app ad spend reflects both an increase in the number of advertisers and increased spending from those advertisers. While competition is increasing, at the same time the cost per install from mobile app ads has actually gone down, making them more attractive.” 
When comparing mobile app ad performance across operating systems, the data indicates that Android targeted ads are priced lower than iOS devices, with a CPC of $0.39 and $0.54 respectively, although the gap appears to have narrowed since last year.
The CTR gap between Android and iOS-targeted ads has also fallen in 2015, but Android still holds a slight edge when it comes to engagement, with a CTR of 1.3 per cent, compared to 1 per cent for iOS). When users click on an ad, those on Android are slightly more likely to install an app than those on iOS, with click- to-install rates of 31.5 per cent and 29.5 per cent respectively.
Analysing mobile app ad performance across app types suggests that the CPC for ads supporting consumer apps ($0.19) is lower than for gaming ($0.61) and other apps ($0.58). While the wider appeal of consumer apps may be the reason why ads drive a higher CTR (1.55 per cent) than for gaming (0.97 per cent) and other apps (1.17 per cent).
However the likelihood that a user will actually install an app after clicking an ad (click-to-install rate) is 36 per cent for gaming apps compared with 19 per cent for consumer apps, implying that the broad appeal of consumer apps gives way to higher intent for gaming.
Looking at the amount of spend that is targeted at specific countries, the US still accounts for the largest portion of targeted spend, and English-speaking countries make up the top four, with the UK, Canada and Australia, occupying second, third and fourth places respectively.

Want more like
this to your inbox?
Popular topics
You might also be interested in