A deep dive into Apple Search Ads
- Wednesday, September 6th, 2023
- Share this article:

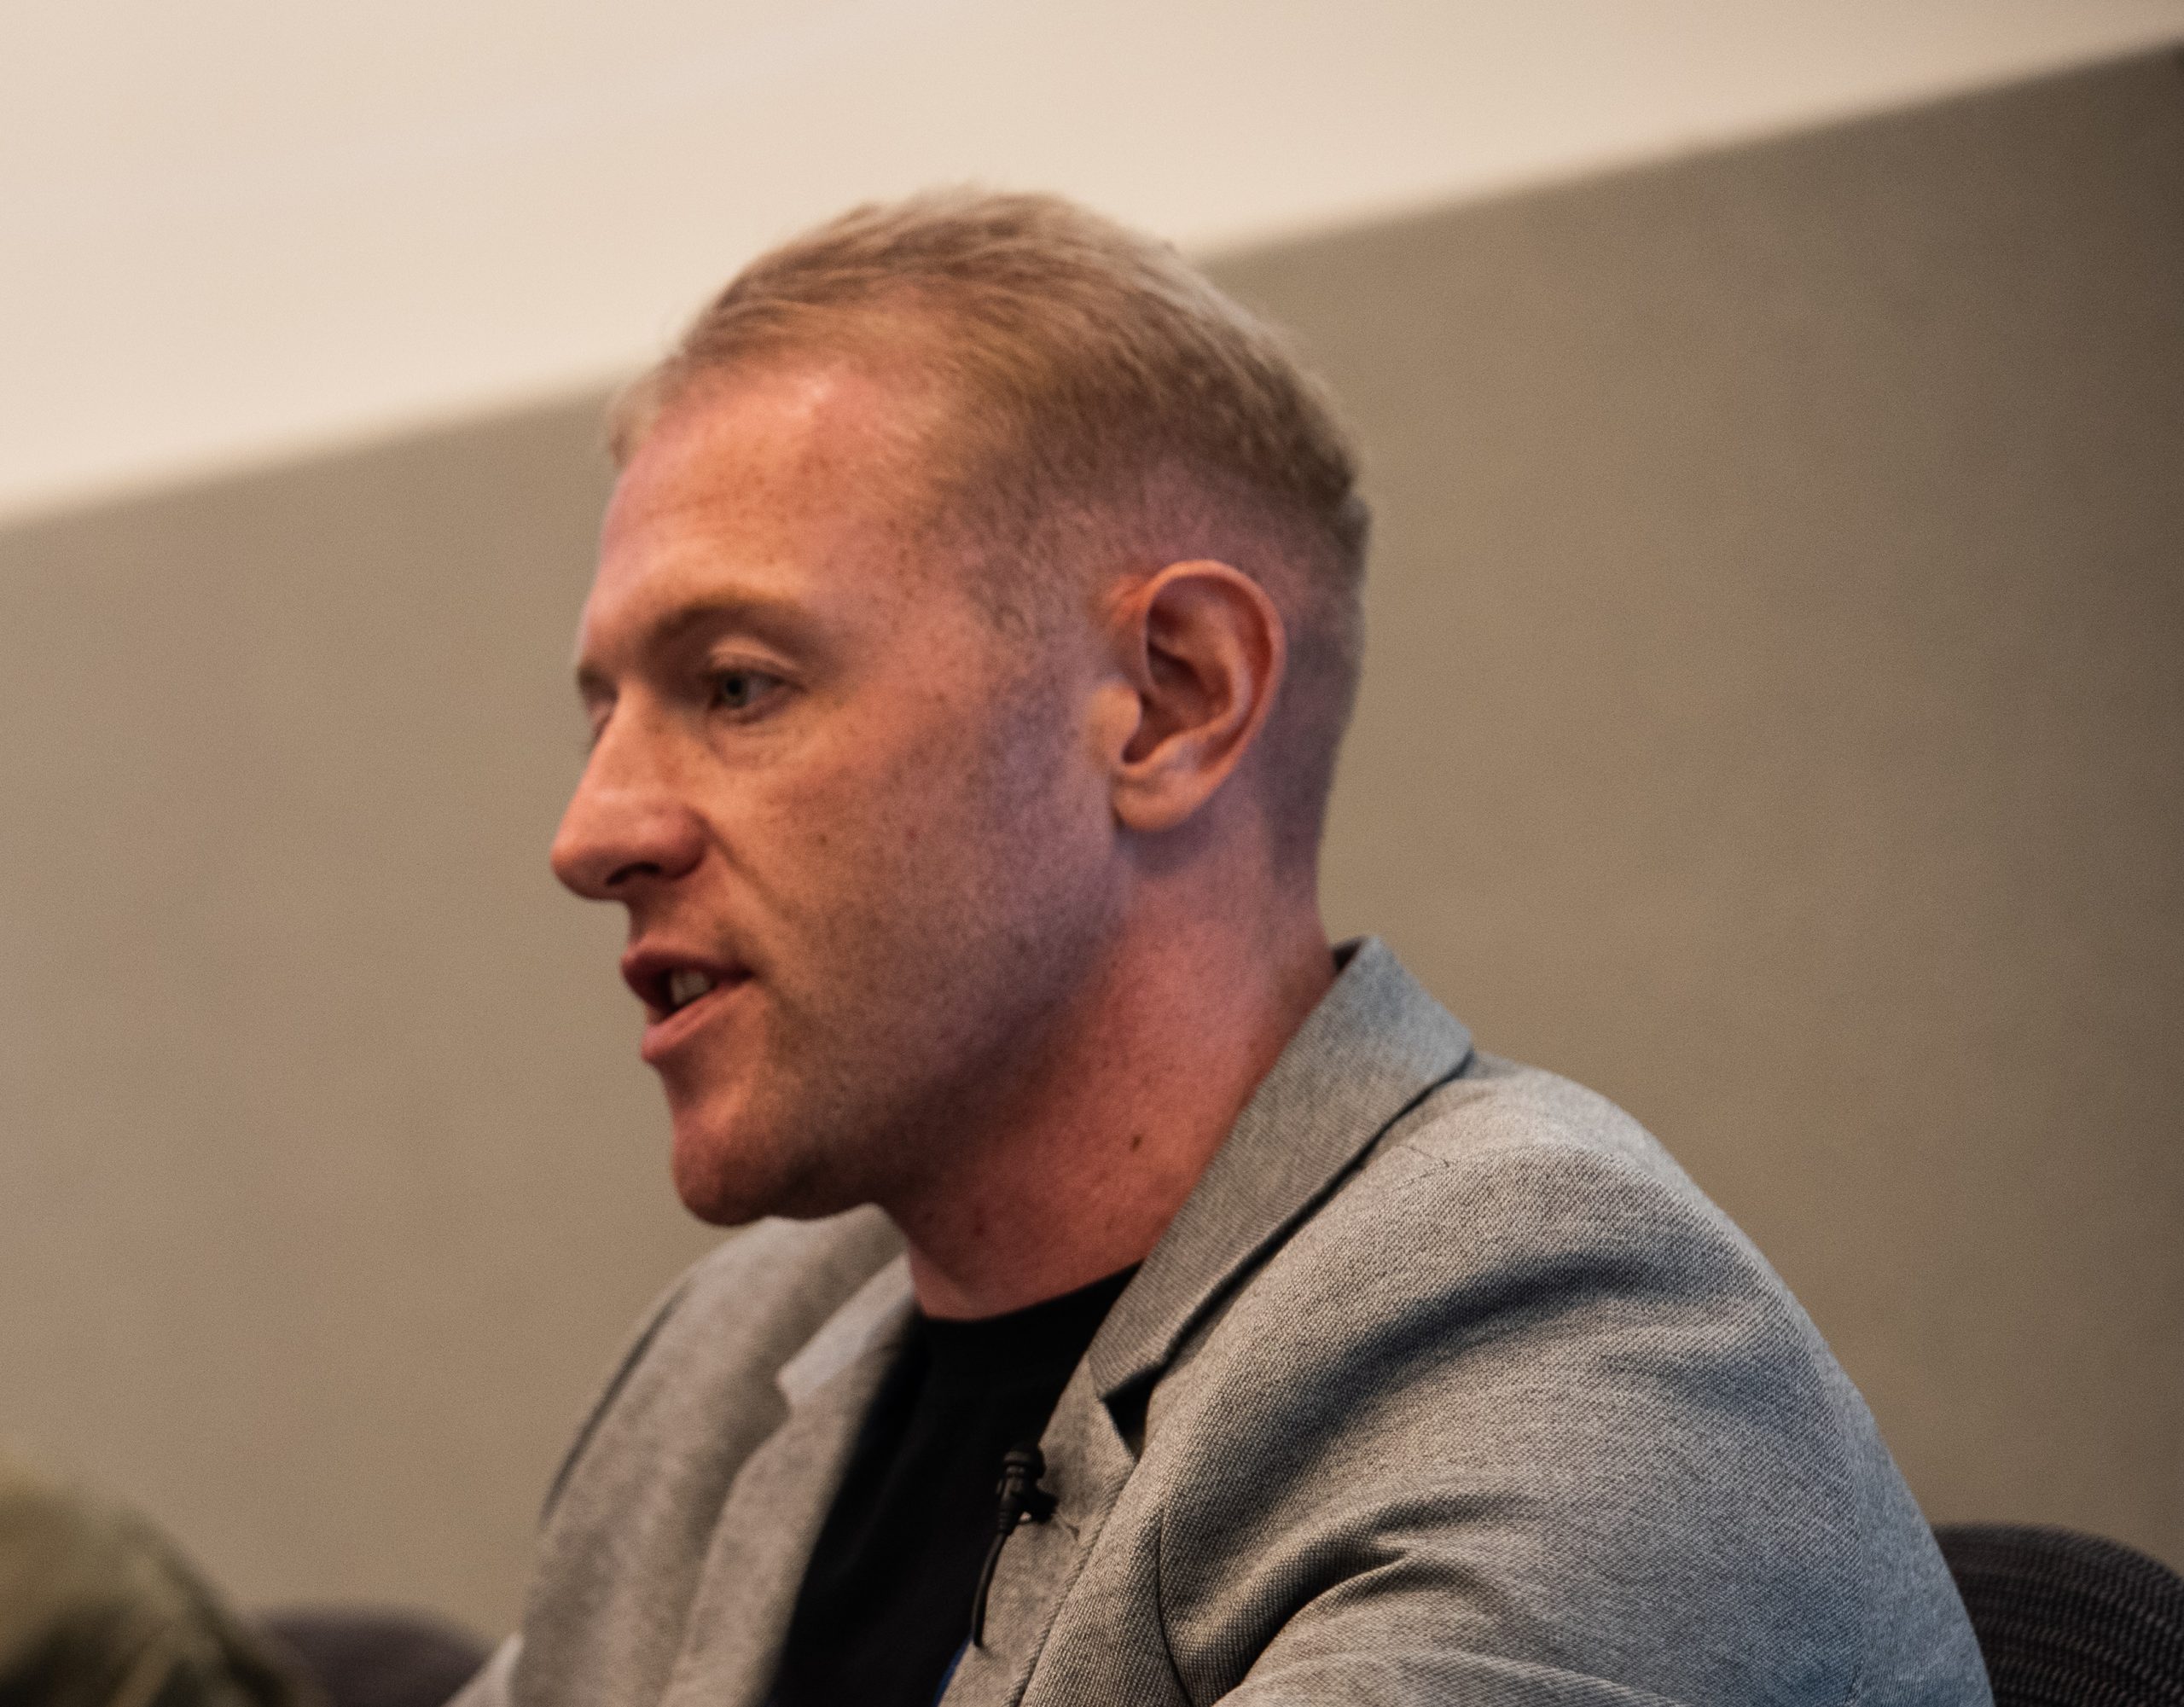
Lexi Sydow, Head of Insights at data.ai (pictured) and Samuel Chorlton, CTO at Redbox Mobile discuss Apple Search Ads.
 I had the pleasure of taking part in a webinar recently where Samuel Chorlton, CTO at Redbox Mobile, an award-winning ASO and ASA agency, and myself, spent an hour getting deep into Apple Search Ads (ASA), looking at how much they cost and how app marketers can feel for what they should be paying to be seen in search results on the App Store. Here’s a summary of what we discussed…
Cost-per-tap vs. cost-per-download explained
There is sometimes confusion over some of the metrics used in app marketing. In ASA terms, the cost-per-tap is essentially the cost of getting a user to click (tap) on the paid search ad, that will then take them to your App Store page. Cost-per-download is a little bit more downstream, and, if you think about it, is always going to be more expensive because not everyone who lands on your App Store will go on to download the app. So if one person in every 10 who clicks on your Apple Search Ad goes on to download the app, it stands to reason that the cost-per-download is 10x the cost-per-tap.
This is why your App Store assets, including your icon, imagery, app description and more, are so important in helping to maximise the conversion rate, from the click to the download.
Calculating what your cost-per-tap and cost-per-download should be It’s important for app marketers to know what their cost-per-tap should be, but not always easy to know how to get to this number, so during the webinar, we looked at some of the tools out there that can help.
At data.ai, we have our own databases that give you an idea of the average cost-per-tap and per-download for specific keywords. They also enable you to compare the costs in different industries, say hotels versus food delivery, for instance.
For instance, in March 2023, for fast food apps, we saw that the cost-per-tap in the US was sitting around, $2.01. In the UK it was $1.38. (We always convert costs to US dollars, for consistency across markets.) The cost-per-install was about $5.16 in the US and $3.19 in the UK.
These costs will vary by keyword, but on the whole, for keywords associated with some of the top fast food apps, for instance, what’s interesting is that, based on those cost-per-tap and cost-per-download rates, the average conversion rate is looking around 30-something per cent. Thats interesting because Apple generally sees an average conversion rate of 50 per cent, so its important not to just assume you will definitely achieve this.
For some of our clients, we can average conversion rates well up into the 80 per cents, but equally we see ones where it can be much, much lower down in the 30 per cents, and you really need to factor that in.
Also, when I was looking at this data, I also pulled the maximum and minimum numbers just to get a feel for what would be the maximum bid for a given keyword within, for example, the food delivery space at that time.
It could just be one isolated keyword, or it could be a number of keywords hitting that number. So for food delivery, we saw the max that we hit in this timeframe in the US was $6.04 cost-per-tap and then $19.90 cost-per-install. In the UK, the max cost-per-tap was $2.99 compared to the average at $1.35 and then $9.26 for cost-per-install compared to the average of $3.44. So, there can be an extreme amount of variance depending on the country and the type of app as well, which is really interesting.
Within data.ai also, you can see which specific apps are bidding on a specific keyword. Are they on a par with the average? Are they higher or are they lower? So that gives you an indication of their strategy, and how theyre ranking.
Search volume is another interesting area to look at. Is there a ton of search volume for a particular keyword? Investigating this gives you an idea of the demand associated with the keyword from the consumer side, and that could help inform your how competitive it might be, and then to prioritize your keywords accordingly
So if there is a lot of search volume associated with a particular keyword, it might make sense for you to bid on that keyword to be seen, but on the other hand, it may be more competitive, and therefore more expensive.
Also within our tool, for each keyword, you can see what percentage of the impressions for a given period are owned by, say, one particular app, which can be a good way to get a feel for directionality. 

So this sort of data is very useful, and even if you don’t have access to the tool, we regularly put out reports to help app marketers keep informed on those industry benchmarks.
The other way to get a feel for it, without spending any money, is, if youve set your target, go to the app stores and see what other apps naturally are appearing above in that space for the keyword that youve set certain targets for. If you see ads from a competitor, that would indicate that your cost targets are probably a little bit too low.
Another interesting area look at is reviews. This won’t give you a direct benchmark for a price to aim for, but looking at reviews and what users are saying about your app or your competitors’ apps, and analysing the type of language used can give you a good idea of action and intent.
There are also some good, free tools that look at demand over time. If you can get a proxy for how the demand might be flowing, then that could help indicate preemptively, once youve done your testing, of your own personal benchmark there, and then you could start to do a little bit more forecasting around that demand organically, and optimize your price around that, given assumptions of how the organic demand might be performing.
The point of monetization
All spending on app marketing is designed to generate revenues for your business. So it’s essential to work out where the point of monetization is for your app, and at what price point do you need to be able to acquire users for them to deliver positive lifetime value, or whatever KPI your business uses.
And this is where it does get slightly more complicated, because you might have a 50 per cent conversion rate from tap to download, but the conversion rate from download to subscription might only be 5 per cent. At which point, if you are charging $10 for a subscription, you need to work out “OK, actually, I can only afford to pay 50 cents per tap, as opposed to the 60 cents I’m currently paying”, or whatever the numbers are.
So its really important to keep revisiting these points, and also to look at whether it is actually achievable. Just saying, “I need to get my users for 10 cents”, might not be realistic or achievable, and perhaps Apple Search ads is the wrong mechanism through which to acquire those users.
This is the real critical part of looking at the benchmarks, looking at the keywords that you’re bidding on, maybe you can afford to spend a bit more when theyre super valuable, and then spend less on others to balance it out.
The same principle applies to seasonality. It’s important when it might benefit you to allocate more budget because it might be more competitive, rather than just saying: “Ive got $10,000 a month, thats my marketing budget.” It might make more sense to spend $30,000 one month, and then very little the couple of months following that.
In Q1 of this year, we saw that calorie-counting apps saw really strong growth in the UK, Germany and Australia. So it might be a bit more competitive at that time when everyone’s trying to jump on the trend, but equally, that’s where the demand is. So understanding how seasonality might affect when and where you allocate your budget is really important.
Future trends
The key thing on everyone’s radar right now is how user acquisition on mobile looks in light of IDFA deprecation and Google’s Privacy Sandbox. With gaming in particular, marketers want to understand how that impacts in-game spend, as it becomes harder, or indeed impossible, to target the whales – the guys or women who spend the bulk of the money in the game. We get a ton of questions, especially in the gaming space, around that, so it’s an area of were watching carefully to see how it develops, and we’ll continue to update the market on that.
With tighter budgets, we’re also seeing a renewed emphasis on organic optimization and paid search, and some very sophisticated stuff from retail apps, coming out of other markets like China, and breaking into new markets in new ways because theyre able to be a bit freer in terms of how they approach things.
Ali Express was a good example of that, it’s had some good traction in Europe and the US. Also Shein, and Temu is the latest one. They were very sophisticated in their mobile first strategies and they leveraged paid search ads heavily. In the US, they strategically leveraged the Super Bowl as a tentpole event that they were advertising on, and their creatives were all Super Bowl-themed in the app store.
So I think for some markets its, its really important to look at how these mobile-first players are breaking into new markets by employing very sophisticated user acquisition strategies. Its amazing what companies can do when they dont necessarily have the same degree of constraints as the incumbent players.

Want more like
this to your inbox?
Popular topics
You might also be interested in